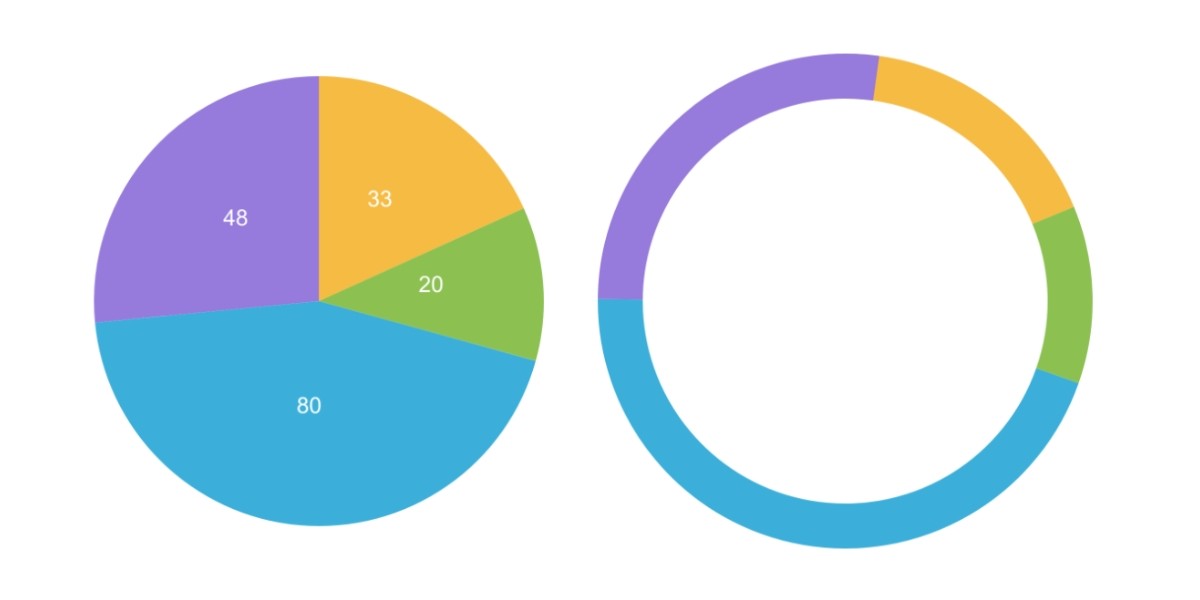
JavaScript core pre Pie a Donut SVG grafy
Verím, že funkcie uvedené v tomto blogu môžu niekomu pomôcť pri tvorbe custom Pie/Donut chartov v SVG. Funkcie si môžete upraviť podľa vlastnej potreby a verím, že niekomu dokážu ušetriť kopec času.
Pomocná funkcia pre vytvorenie PIE chartu
Nižšie uvedená funkcia vygeneruje len cestu pre <path element, pozíciu pre <text element a rotáciu pre <g element.
function Pie(cx, cy, radius, data) {

    var decimals = 4;
    var total = 0;
    var offset = 0;
    var offset2;
    var arr = [];
    var x;
    var y;
    var la;
    var radians;

    for (var i = 0; i < data.length; i++)
        total += data[i].value;

    for (var i = 0; i < data.length; i++) {

        var item = data[i];
        var tmp = {};

        tmp.index = i;
        tmp.value = item.value;
        radians = ((((item.value / total) * 360) * Math.PI) / 180).floor(decimals);
        offset2 = ((offset / total) * 360).floor(decimals);
        tmp.data = item;

        x = (cx + Math.sin(radians) * radius).floor(decimals);
        y = (cy - Math.cos(radians) * radius).floor(decimals);
        la = radians > Math.PI ? 1 : 0;

        // Arc
        tmp.d = 'M{0} {1},L{0} {2},A{3} {3},0 {4} 1,{5} {6}Z'.format(cx, cy, cy - radius, radius, la, x, y);
        tmp.transform = 'rotate({0}, {1}, {2})'.format(offset2, cx, cy);

        // Text
        x = (cx + Math.sin(radians / 2) * radius / 2).floor(decimals);
        y = (cy - Math.cos(radians / 2) * radius / 2).floor(decimals);
        tmp.text = 'x="{0}" y="{1}" transform="rotate({2},{0},{1})"'.format(x, y, -offset2);

        offset += item.value;
        arr.push(tmp);
    }

    return arr;
}
Použitie PIE chartu
var svg = $('#yoursvgelement');
var data = [{ value: 33 }, { value: 20 }, { value: 80 }, { value: 48 }];
var centerX = 300;
var centerY = 300;
var radius = 250;
var color = ['#F6BB42', '#8CC152', '#3BAFDA', '#967ADC', '#DA4453'];

var arr = Pie(centerX, centerY, radius, data);
for (var i = 0; i < arr.length; i++) {
    var item = arr[i];
    svg.asvg('<g transform="{0}"><path d="{1}" fill="{4}" /><text fill="white" font-size="25" {2}>{3}</text></g>'.format(item.transform, item.d, item.text, item.value, color[i]));
}
Pomocná funkcia pre vytvorenie DONUT chartu
Nižšie uvedená funkcia vygeneruje len cestu pre <path element, pozíciu pre <text element a rotáciu pre <g element.
function Donut(cx, cy, radius, data) {

    function arcradius(cx, cy, radius, degrees) {
        var radians = (degrees - 90) * Math.PI / 180.0;
        return { x: cx + (radius * Math.cos(radians)), y: cy + (radius * Math.sin(radians)) };
    }

    var decimals = 4;
    var total = 0;
    var arr = [];
    var beg = 0;
    var end = 0;
    var count = 0;

    var half = radius / 2;
    var midpoint = radius / 2.4;

    for (var i = 0; i < data.length; i++)
        total += data[i].value;

    for (var i = 0; i < data.length; i++) {
        var item = data[i];
        var tmp = {};

        var p = (((item.value + 1) / total) * 100).floor(2);

        count += p;

        if (i === length - 1 && count < 100)
            p = p + (100 - count);

        end = beg + ((360 / 100) * p);
        tmp.index = i;
        tmp.value = item.value;
        tmp.data = item;

        var b = arcradius(cx, cy, radius, end);
        var e = arcradius(cx, cy, radius, beg);
        var la = (end - beg) <= 180 ? 0 : 1;

        tmp.d = ['M', b.x.floor(decimals), b.y.floor(decimals), 'A', radius, radius, 0, la, 0, e.x.floor(decimals), e.y.floor(decimals)].join(' ');
        arr.push(tmp);
        beg = end;
    }

    return arr;
}
Donut chart usage
var svg = $('#yoursvgelement');
var data = [{ value: 33 }, { value: 20 }, { value: 80 }, { value: 48 }];
var centerX = 300;
var centerY = 300;
var radius = 250;
var color = ['#F6BB42', '#8CC152', '#3BAFDA', '#967ADC', '#DA4453'];

var arr = Donut(centerX, centerY, radius, data);
for (var i = 0; i < arr.length; i++) {
    var item = arr[i];
    svg.asvg('<g><path d="{0}" stroke="{1}" fill="none" stroke-width="50" /></g>'.format(item.d, color[i]));
}
